You probably want something with more power/control, but I’ve at times enjoyed using GraphViz’s Dot language. The online version is an easy way to get started.
The starter example they give is quite complex, so you might begin by replacing the code with this starter:
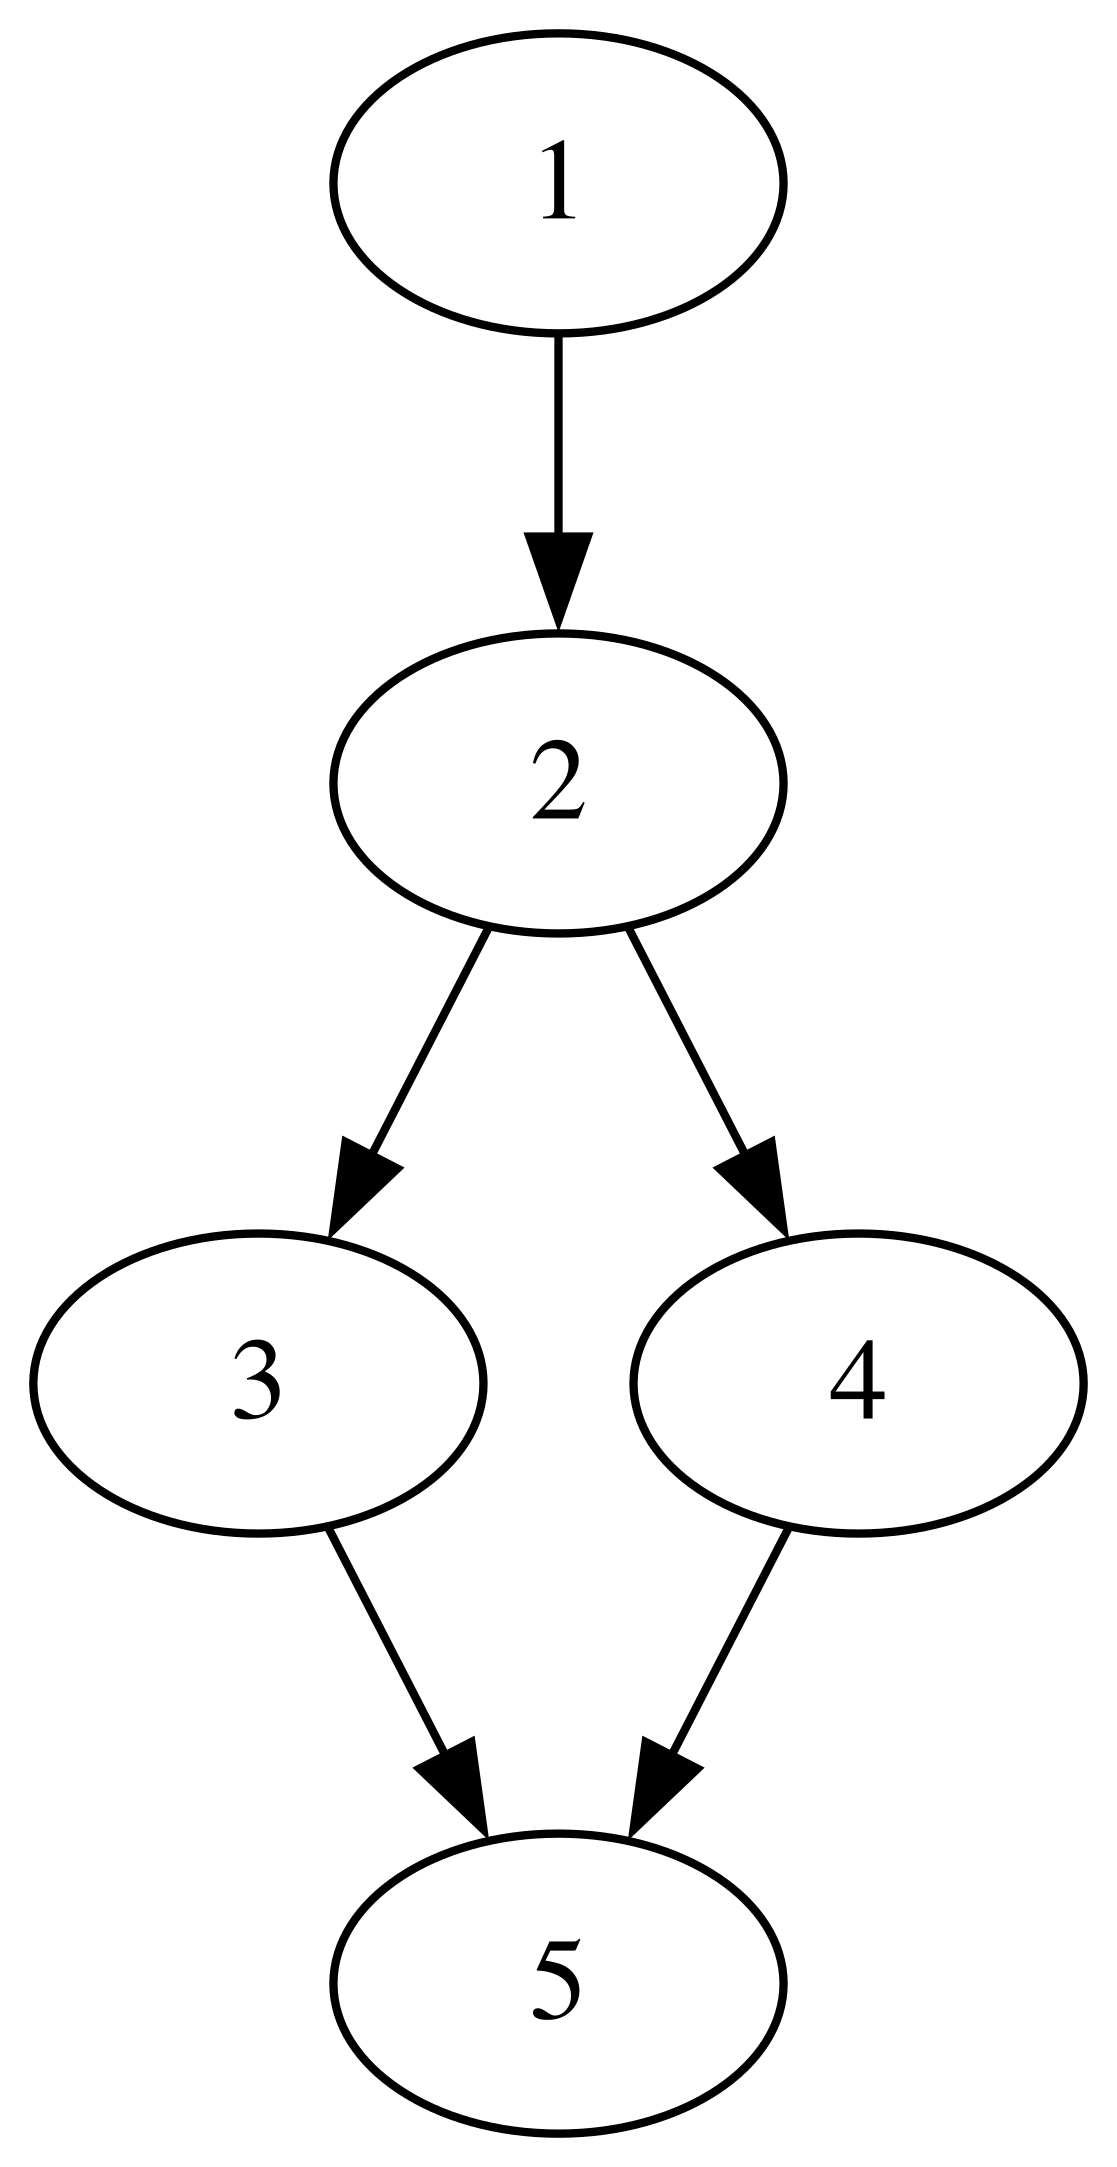
digraph G {

  1 -> 2 -> 3 -> 5;
  2 -> 4;
  4 -> 5;
}
That will automatically render an image like this:
The premise of the Dot language is that you just type the node names and connections between nodes (edges), and GraphViz will try to pick a good placement for the nodes/edges.
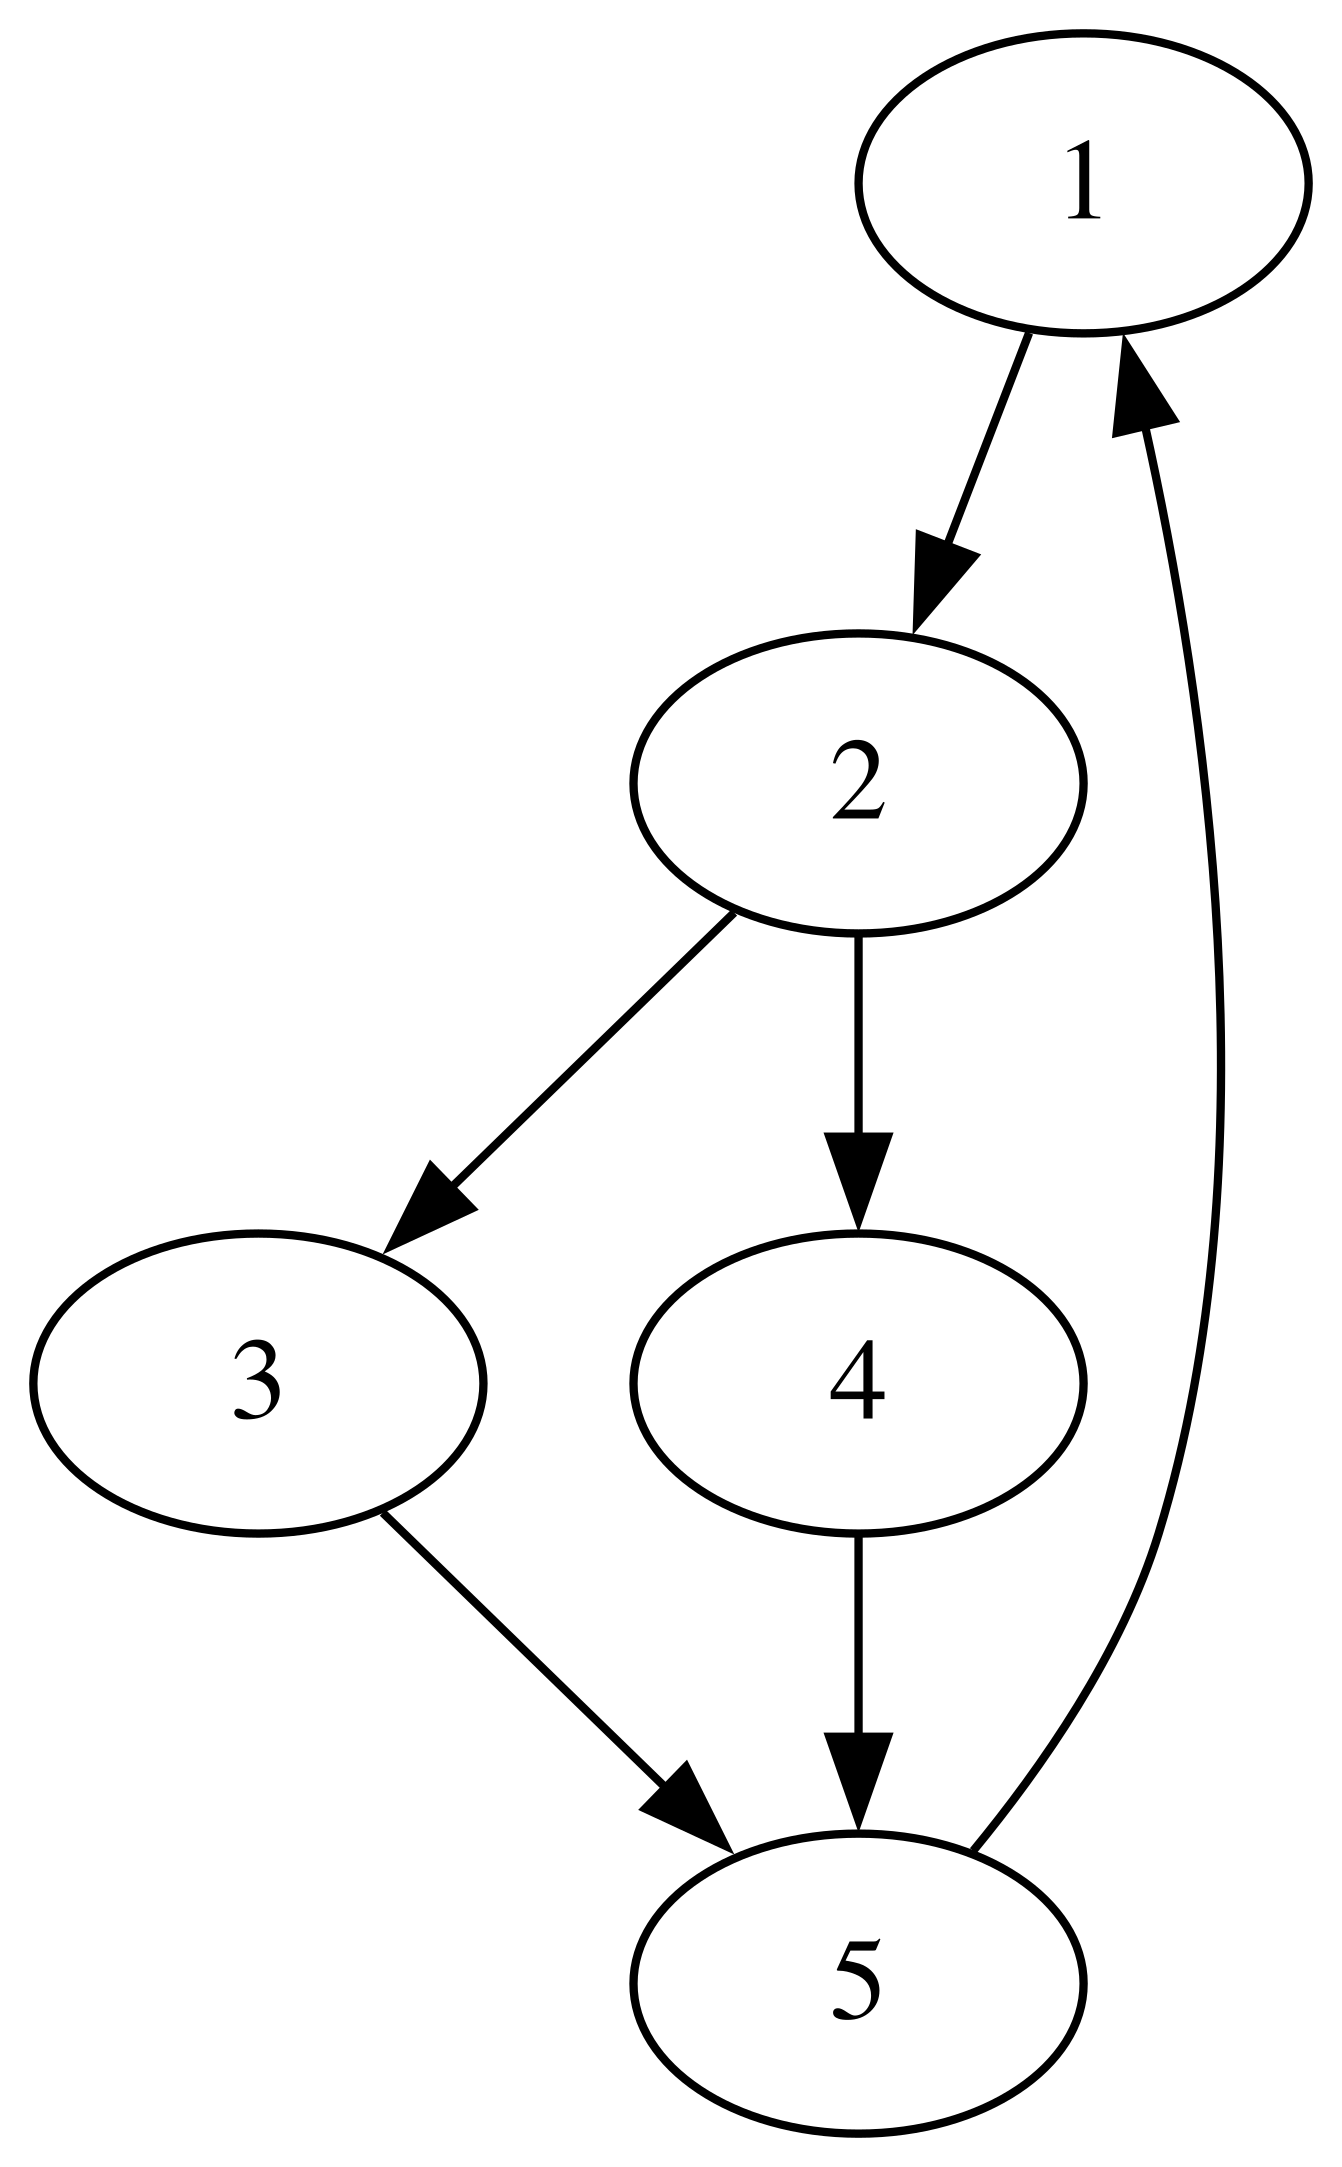
If you add 5 -> 1 like this:
digraph G {

  1 -> 2 -> 3 -> 5;
  2 -> 4;
  4 -> 5;
  5 -> 1;
}
You’ll get this:
See how it scooted the nodes around?
You can label the edges.
digraph G {

  1 -> 2 -> 3 -> 5;
  2 -> 4;
  4 -> 5;
  5 -> 1 [label="looping back"];
}
You can name the nodes whatever you want in quoted strings, including multi-line strings.
digraph G {

  "this is\nthe start" -> 2 -> 3 -> 5;
  2 -> 4;
  4 -> 5;
  5 -> "this is\nthe start" [label="looping back"];
}
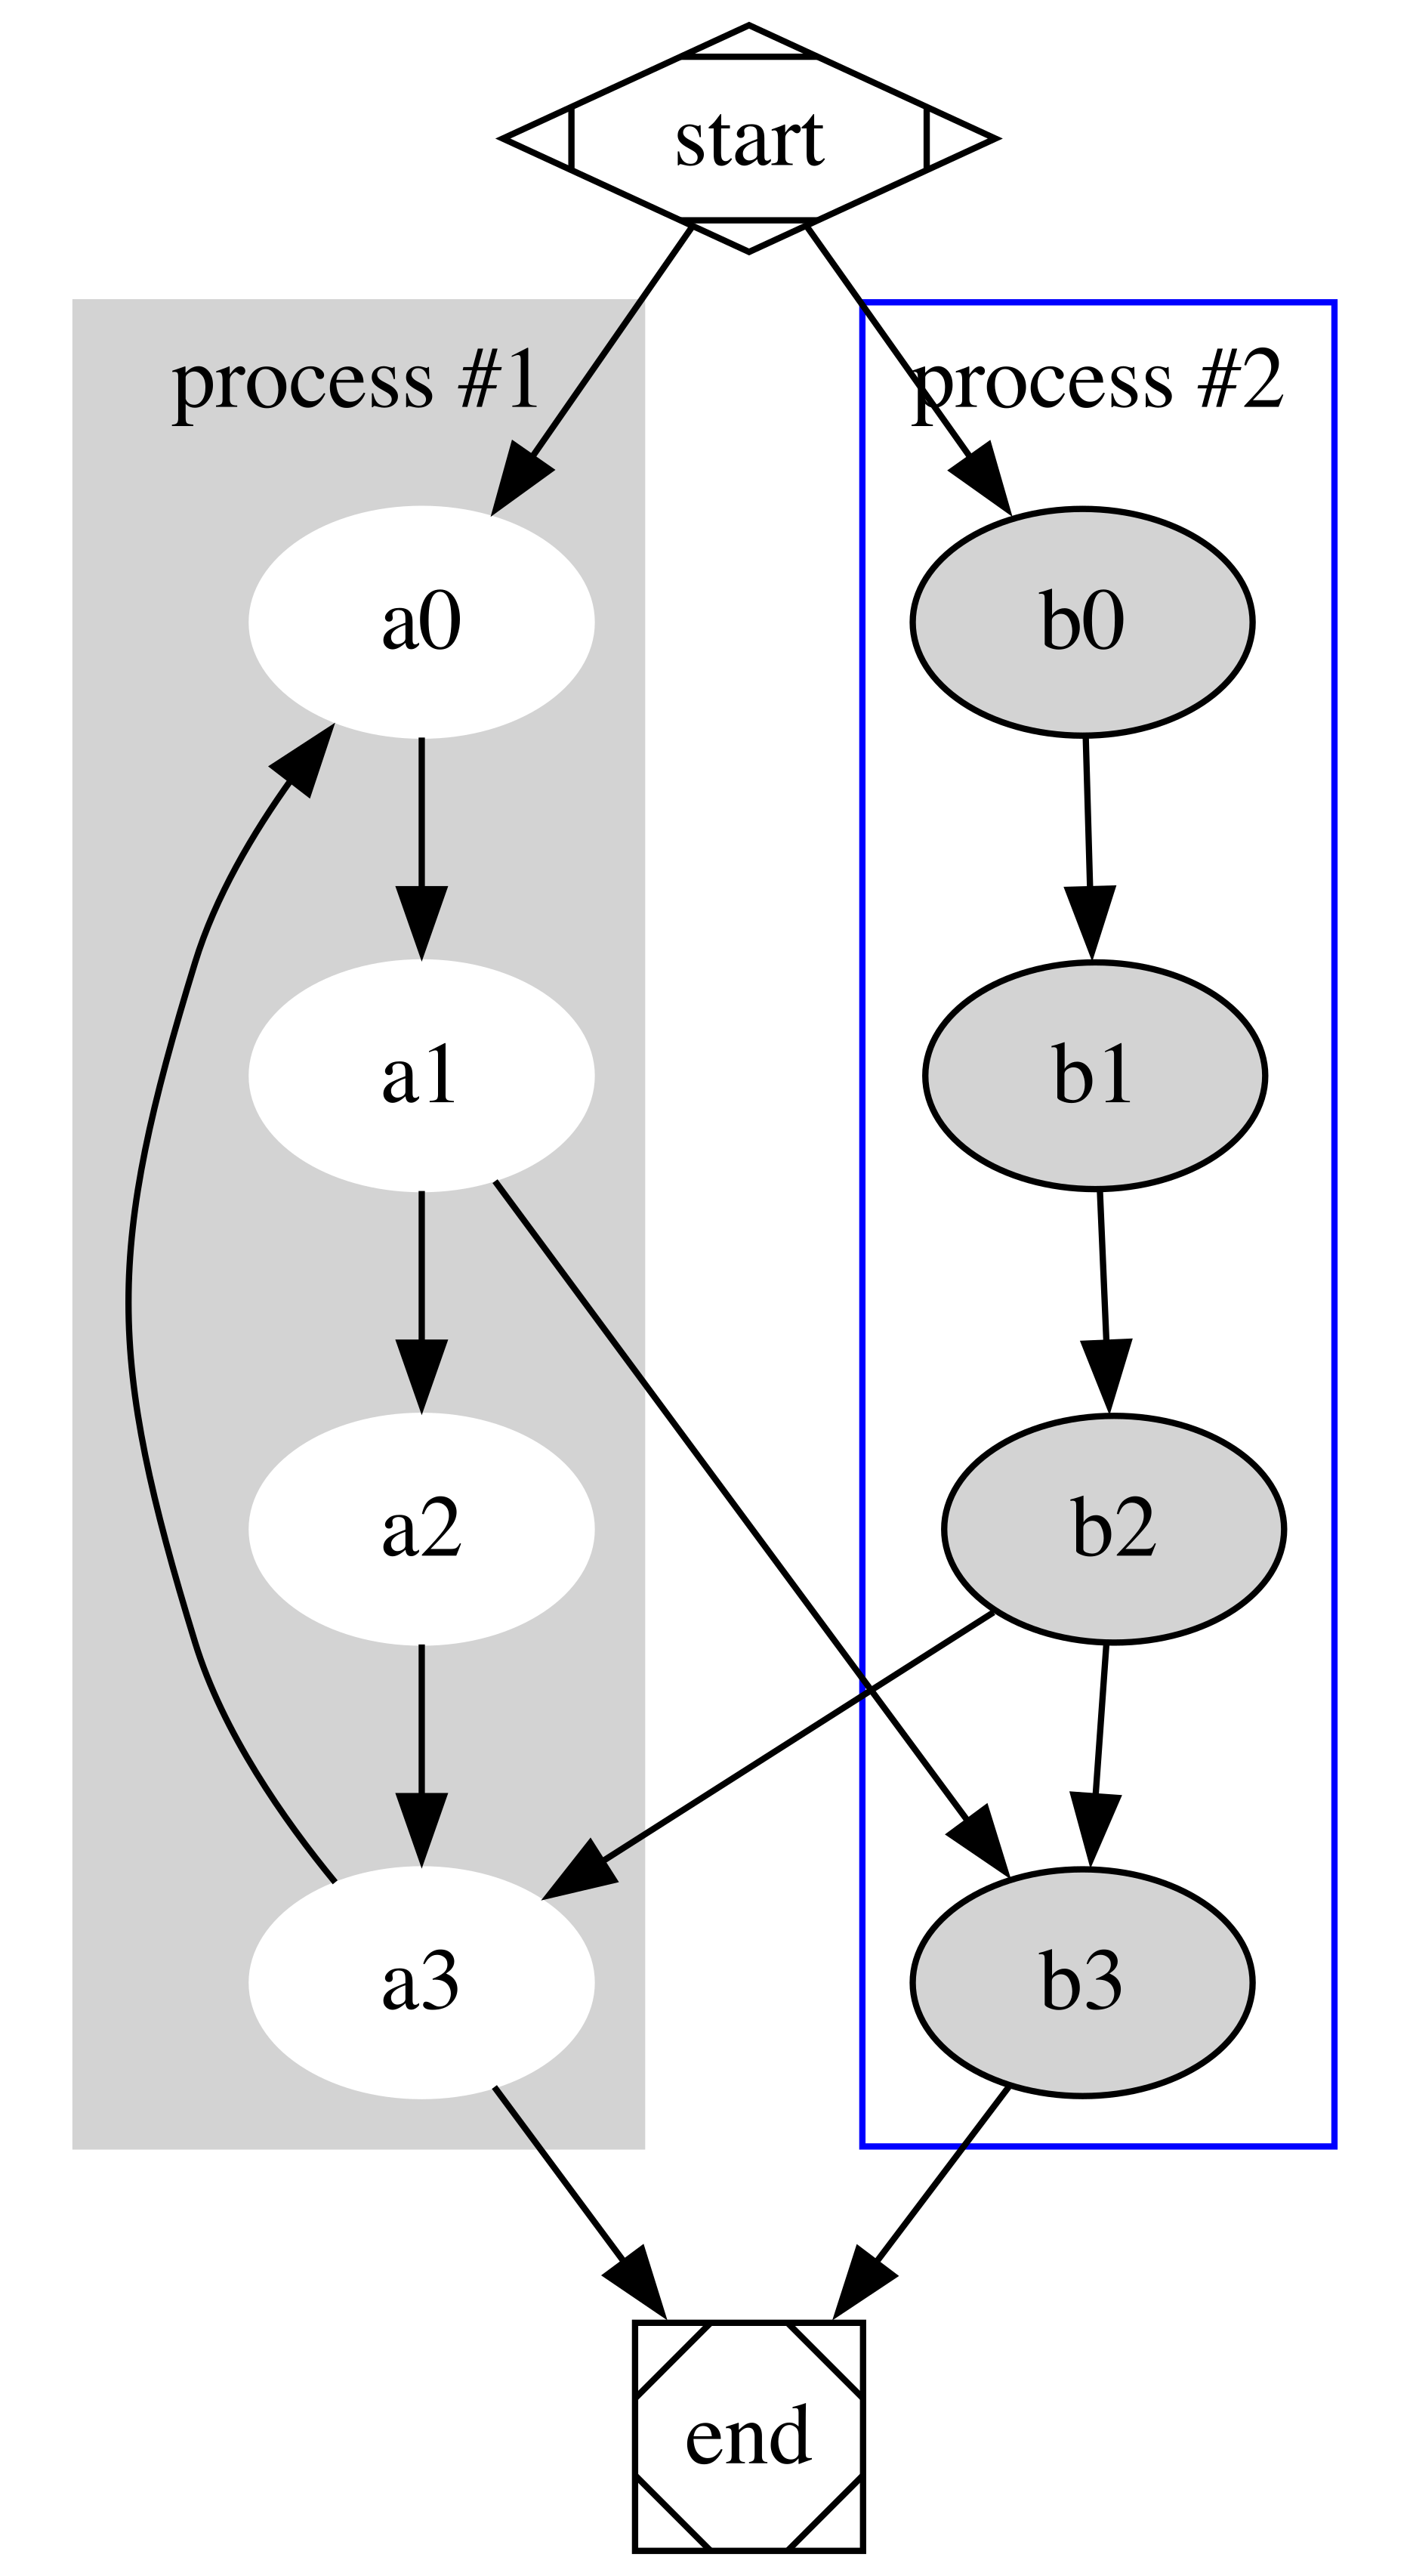
If you want to label part of the diagram, well, you’ve kinda gotta put a box around it so people know which part of the diagram you’re talking about. You do that with a labeled subgraph.
Their starting example has two labeled subgraphs.
digraph G {

  subgraph cluster_0 {
    style=filled;
    color=lightgrey;
    node [style=filled,color=white];
    a0 -> a1 -> a2 -> a3;
    label = "process #1";
  }

  subgraph cluster_1 {
    node [style=filled];
    b0 -> b1 -> b2 -> b3;
    label = "process #2";
    color=blue
  }
  start -> a0;
  start -> b0;
  a1 -> b3;
  b2 -> a3;
  a3 -> a0;
  a3 -> end;
  b3 -> end;

  start [shape=Mdiamond];
  end [shape=Msquare];
}