![]()
3 Likes
Hey, I even included a silly emoji to indicate that I was being facetious!
2 Likes
Sorry, the emoji didn’t come through when I pasted - it’s all good!
Anyway clearly 2021 was a great year for smart people who don’t follow the crowd, it was a thinking persons’ feast.
2 Likes
Some second layer analysis based on the games listed above…
TOP 50 AUTHORS BY NUMBER OF TOP GAMES

Rank	Author						Top Games	Top Games Plays	Avg Plays/Top Game
----	-------------------			---------	---------------	------------------
1		Emily Short					18			2974			165.22
2		Ryan Veeder					17			 831			 48.88
3		Chandler Groover			12			 933			 77.75
4		Andrew Plotkin				11			2216			201.45
5		C.E.J. Pacian				10			 883			 88.30
6		John Olsen					10			  45			  4.50
7		Adam Cadre					 9			2631			292.33
7		Arthur DiBianca				 9			 406			 45.11
9		Jon Ingold					 8			 717			 89.63
9		Brendan Patrick Hennessy	 8			 679			 84.88
9		mathbrush					 8			 435			 54.38
9		Anonymous					 8			 216			 27.00
13		Victor Gijsbers				 7			 565			 80.71
13		Porpentine					 7			 545			 77.86
13		Eric Eve					 7			 422			 60.29
13		Stephen Granade				 7			 388			 55.43
17		Paul O'Brian				 5			 364			 72.80
17		Astrid Dalmady				 5			 307			 61.40
17		Amanda Walker				 5			 186			 37.20
20		Ian Finley					 4			 408			102.00
20		Graham Nelson				 4			 386			 96.50
20		J. J. Guest					 4			 273			 68.25
20		Steph Cherrywell			 4			 270			 67.50
20		Nick Montfort				 4			 264			 66.00
20		Liza Daly					 4			 210			 52.50
20		Robin Johnson				 4			 201			 50.25
20		Autumn Chen					 4			 146			 36.50
20		Agnieszka Trzaska			 4			 122			 30.50
20		Neil deMause				 4			  90			 22.50
20		D. A. Leary					 4			  62			 15.50
20		Paul Allen Panks			 4			  22			  5.50
20		Robert Parker				 4			   8			  2.00
33		michael lutz				 3			 375			125.00
33		Buster Hudson				 3			 357			119.00
33		Aaron A. Reed				 3			 288			 96.00
33		Abigail Corfman				 3			 215			 71.67
33		Mike Spivey					 3			 205			 68.33
33		J. Robinson Wheeler			 3			 150			 50.00
33		Magnus Olsson				 3			 125			 41.67
33		Michael J. Roberts			 3			 117			 39.00
33		Sara Dee					 3			 115			 38.33
33		Jim Aikin					 3			 114			 38.00
33		Wade Clarke					 3			 108			 36.00
33		Ade McT						 3			 107			 35.67
33		Ben Jackson					 3			 105			 35.00
33		Dan Shiovitz				 3			  99			 33.00
33		Robb Sherwin				 3			  99			 33.00
33		J. D. Berry					 3			  89			 29.67
33		G. Kevin Wilson				 3			  87			 29.00
33		Juhana Leinonen				 3			  78			 26.00
33		Kit Riemer					 3			  78			 26.00
33		Simon Christiansen			 3			  75			 25.00
33		David P. Gray				 3			  19			  6.33
Note that I-0 has been credited to its author (Adam Cadre) for this table.
Authors tying on “Top Games” are given the same rank but shown in descending order by total plays across all of their listed games, then alphabetically.
4 Likes
Also, a second layer analysis where ranking is by total plays across all of the author’s games from the yearly charts above:
TOP 50 AUTHORS BY TOTAL PLAYS OF TOP GAMES

Rank	Author									Top Games	Top Games Plays	Avg Plays/Top Game
----	---------------------					---------	---------------	------------------
1		Emily Short								18			2974			165.22
2		Adam Cadre								 9			2631			292.33
3		Andrew Plotkin							11			2216			201.45
4		Chandler Groover						12			 933			 77.75
5		C.E.J. Pacian							10			 883			 88.30
6		Ryan Veeder								17			 831			 48.88
7		Jon Ingold								 8			 717			 89.63
8		Admiral Jota							 1			 711			711.00
9		Brendan Patrick Hennessy				 8			 679			 84.88
10		Victor Gijsbers							 7			 565			 80.71
11		Jeremy Freese							 1			 558			558.00
12		Porpentine								 7			 545			 77.86
13		Sam Barlow								 1			 499			499.00
14		mathbrush								 8			 435			 54.38
15		Eric Eve								 7			 422			 60.29
16		Ian Finley								 4			 408			102.00
17		Arthur DiBianca							 9			 406			 45.11
18		Stephen Granade							 7			 388			 55.43
19		Graham Nelson							 4			 386			 96.50
20		michael lutz							 3			 375			125.00
21		Paul O'Brian							 5			 364			 72.80
22		Buster Hudson							 3			 357			119.00
23		David Fisher							 1			 323			323.00
24		Astrid Dalmady							 5			 307			 61.40
25		Star C. Foster and Daniel Ravipinto		 1			 297			297.00
26		Jason Devlin							 2			 296			148.00
27		Lynnea Glasser							 2			 289			144.50
28		Aaron A. Reed							 3			 288			 96.00
29		J. J. Guest								 4			 273			 68.25
30		Steph Cherrywell						 4			 270			 67.50
31		Nick Montfort							 4			 264			 66.00
32		Anonymous								 8			 216			 27.00
33		Abigail Corfman							 3			 215			 71.67
34		Liza Daly								 4			 210			 52.50
35		Stephen Bond							 2			 206			103.00
36		Jim Munroe								 2			 205			102.50
36		Mike Spivey								 3			 205			 68.33
38		Robin Johnson							 4			 201			 50.25
39		J Cater, R Dubbin, E Eve, E Heller		 1			 193			193.00
40		Rob Noyes								 2			 186			 93.00
40		Amanda Walker							 5			 186			 37.20
42		Dan Schmidt								 1			 177			177.00
43		D Dyte, S Bernard, D Shiovitz, I Merr	 1			 171			171.00
44		Christopher Huang						 2			 159			 79.50
45		Andrew D. Pontious						 2			 158			 79.00
46		Gareth Rees								 2			 156			 78.00
47		David Welbourn							 2			 155			 77.50
47		Linus Åkesson							 2			 155			 77.50
49		Porpentine and Brenda Neotenomie		 1			 152			152.00
50		Chris Klimas							 2			 150			 75.00
50		J. Robinson Wheeler						 3			 150			 50.00
3 Likes
As a follow-up to the stats above, I wanted to share a couple of more graphs.
The first graph is the good news: It shows, for each publication year, the number of games from that year which have at least one registered play. (Note that only about 70% of games on IFDB have at least one registered play.)
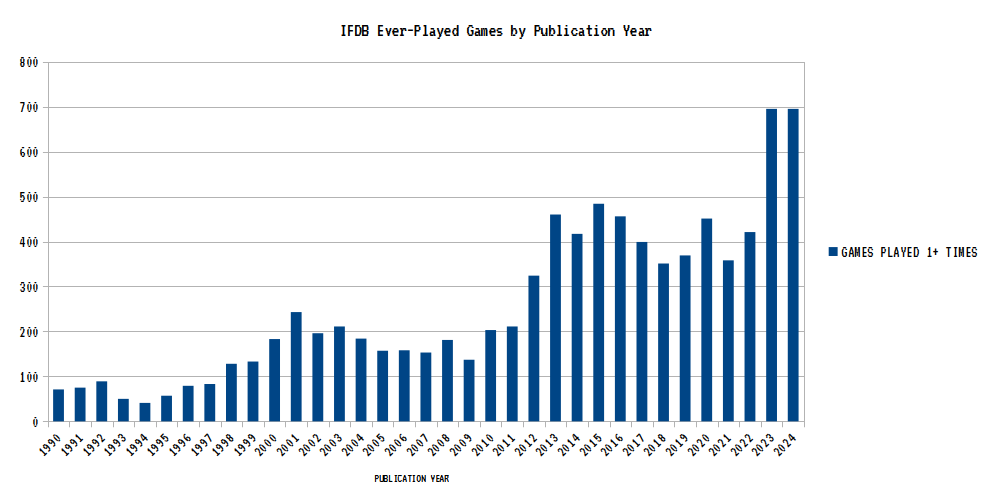
The “twin towers” of 2023 and 2024 are an interesting coincidence, differing by only 1. There has clearly been a huge uptick in widespread playing in the last couple of years (at least of playing being registered on IFDB.)
The second graph is the bad news: It shows for each publication year, the number of people who have registered a play of at least one game published in that year.
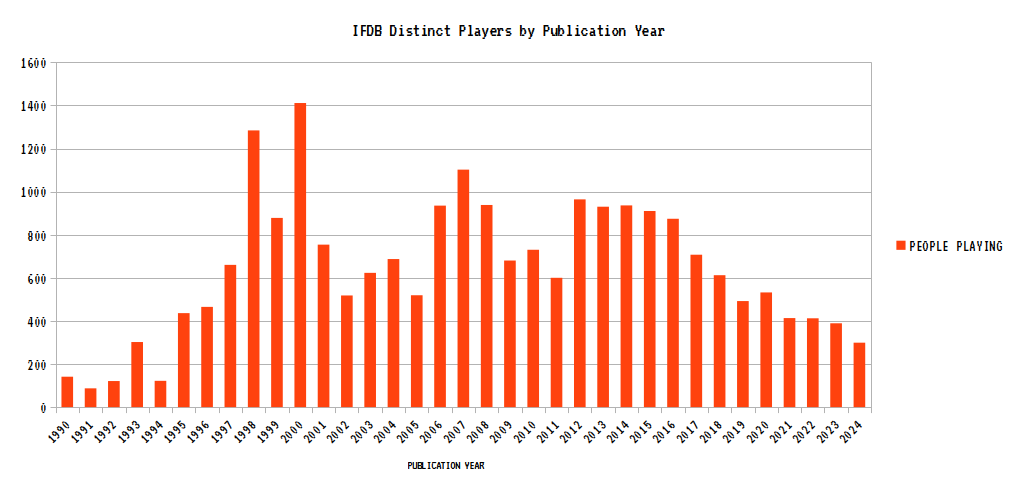
Clearly the 1998 and 2000 spikes reflect a broader pool of people participating on IFDB in the past. Particularly worth noting is the downtrend between 2023 and 2024, though that may to some extent just be a matter of people not yet having gotten around to playing last year’s games.
On the good news side again, with about a quarter fewer players of 2024 games, the number of 2024 games played was functionally the same, so everyone playing them must have played about a third more games compared to those published in 2023.
4 Likes
I wouldn’t call it bad news—just speaking statistically, I would expect a downward slope over time. If we imagine a hypothetical player who picks a page from IFDB purely at random every month, that hypothetical player has had ~36 chances to potentially pick a game from 2022, but only ~24 chances to pick a game from 2023, and ~12 chances to pick a game from 2024.
2 Likes
Well, in any given “play year” (i.e. year in which a game is registered as played) there is a very strong bias toward recently published games (“recently” relative to that play year), but data from the last 10 years shows that a substantial chunk of plays are for games that were published one year prior, so I think you’re right that in the long run (i.e. by next year) the gap between players of 2023 games and players of 2024 games will narrow considerably.
+-----------+-----------+-------+-----------------------+----------------------+
| year_play | year_publ | plays | tot_plays_for_play_yr | pct_of_play_yr_plays |
+-----------+-----------+-------+-----------------------+----------------------+
|      2024 |      2024 |  2779 |                  7920 |              35.0884 |
|      2024 |      2023 |  1237 |                  7920 |              15.6187 |
|      2023 |      2023 |  2923 |                  8029 |              36.4055 |
|      2023 |      2022 |   904 |                  8029 |              11.2592 |
|      2022 |      2022 |  2041 |                  7411 |              27.5401 |
|      2022 |      2021 |   531 |                  7411 |               7.1650 |
|      2021 |      2021 |  1620 |                  6548 |              24.7404 |
|      2021 |      2020 |   619 |                  6548 |               9.4533 |
|      2020 |      2020 |  1980 |                  7125 |              27.7895 |
|      2020 |      2019 |   519 |                  7125 |               7.2842 |
|      2019 |      2019 |   940 |                  4198 |              22.3916 |
|      2019 |      2018 |   561 |                  4198 |              13.3635 |
|      2018 |      2018 |   944 |                  4087 |              23.0976 |
|      2018 |      2017 |   425 |                  4087 |              10.3988 |
|      2017 |      2017 |  1193 |                  5224 |              22.8369 |
|      2017 |      2016 |   840 |                  5224 |              16.0796 |
|      2016 |      2016 |  1643 |                  5591 |              29.3865 |
|      2016 |      2015 |   793 |                  5591 |              14.1835 |
|      2015 |      2015 |  1563 |                  5309 |              29.4406 |
|      2015 |      2014 |   691 |                  5309 |              13.0156 |
+-----------+-----------+-------+-----------------------+----------------------+
Wow. Being at number 10 in this list is paradoxically both humbling and a source of pride.
2 Likes
| 2 | Damon L. Wakes (as Leah Thargic) | 2024 | Uninteractive Fiction
![]()
3 Likes
Including data from the last three months, now The Den is #2 for 2024.
(Uninteractive Fiction is now #3.)
4 Likes
2000 absolutely crushed it, just like I knew it would.
1 Like
1996 leader lol
1 Like