“Recreational mathematics” is what Martin Gardner called what he did. I worshipped those collections of his columns as a kid, and I have them all now. As far as I can tell, it’s just a marketing term, trying not to scare off people who would really be interested.
It includes combinatorics, geometry, computer science, logic, game theory, probability, and just about any other branch of mathematics. And he didn’t shy away from tough calculations or rigorous proofs, either. I remember deep philosophy, discussions of the Axiom of Choice, and paradoxes.
I think all mathematics is recreational.
2 Likes
3-D printed Catalan solids would actually be a nice addition to my collection of maths related objects, especially since only a few are Zome constructible, only one is Polydron constructible, and less than half are readily available as dice(I own some tetrakiscubic d24s, some d30s, some deltoidal d60s, and some d120s, and rhombic d12s, deltoidal d24s, and d48s can be found on Amazon, but that still leaves triakis tetrahedral d12s, 2 types of d24, and 3 types of d60 unaccounted).
My metaphorical kingdom for a good, command-line tool that allows for easily generating stls or vector graphics of mathematical curves and surfaces and a plotter and 3-D printer reliable enough I could print at home without having to worry about troubleshooting that requires sight to do safely… Sadly, but all I’ve found that’s remotely accessible for blind generation of graphics is coding .svg files manually, and the svg markup has no calculation capabilities, so doing so requires doing all of the calculations of where elements should be positioned manually… ANd sadly, even ignoring the GUI and rendering stuff, I don’t know the first thing about programming a graphing calculator, much less one with my dream feature set(among other things, I’d want 2-d graphs to allow cartesian and polar graphs to be drawn superimposed, and for 3-D, I’d not only want to mix cartesian, cylindrical, and spherical coordinates, but to have r, phi, and theta for all three axises not just the z-axis(e.g. rx = 1 is an infinite cylinder of radius 1 centered on teh x-axis, while rz = 2 is a cylinder of raidus 2 centered on the z-axis) r and the ability to take boolean operations on multiple graphs(such as the part of z=-cos(rz) bounded by rz = sin(7thetaz or the interesection of the aforementioned cylinders).
ANd for what it’s worth, I’m a yank, but maths is one of several Britishisms I’ve picked up(along with referring to the Atlantic as the Pond and Americans as yanks… and spelling it aluminium… also have my speech synth set to British English).
I’ve heard a lot about Gardner over the years, but I confess I’ve never really dug into his body of work… Should at least see if there are any hits for him on BARD, though I kind of doubt it, maths texts don’t get turned into audio books all that often from my experience.
2 Likes
I’m away from home and don’t have time to read through and respond to everything, but I can answer this one.
You can’t make joints smooth and con cavity the same simultaneously, since just fixing the joints determines everything when you have rigid pieces and are making the first derivatives fit.
The two tangent lines to the endpoints of your segment have slope + or - 4, and intersect at an angle of 2arctan(4). Since that’s not a rational multiple of 360, copies of them with matching tangent lines wouldn’t fit nicely at all.
But if you instead use the region from x=-.5 to .5, the angle is 90 and you can get lovely pictures:
(These graphs have been adjusted to be centered on (0,0): )
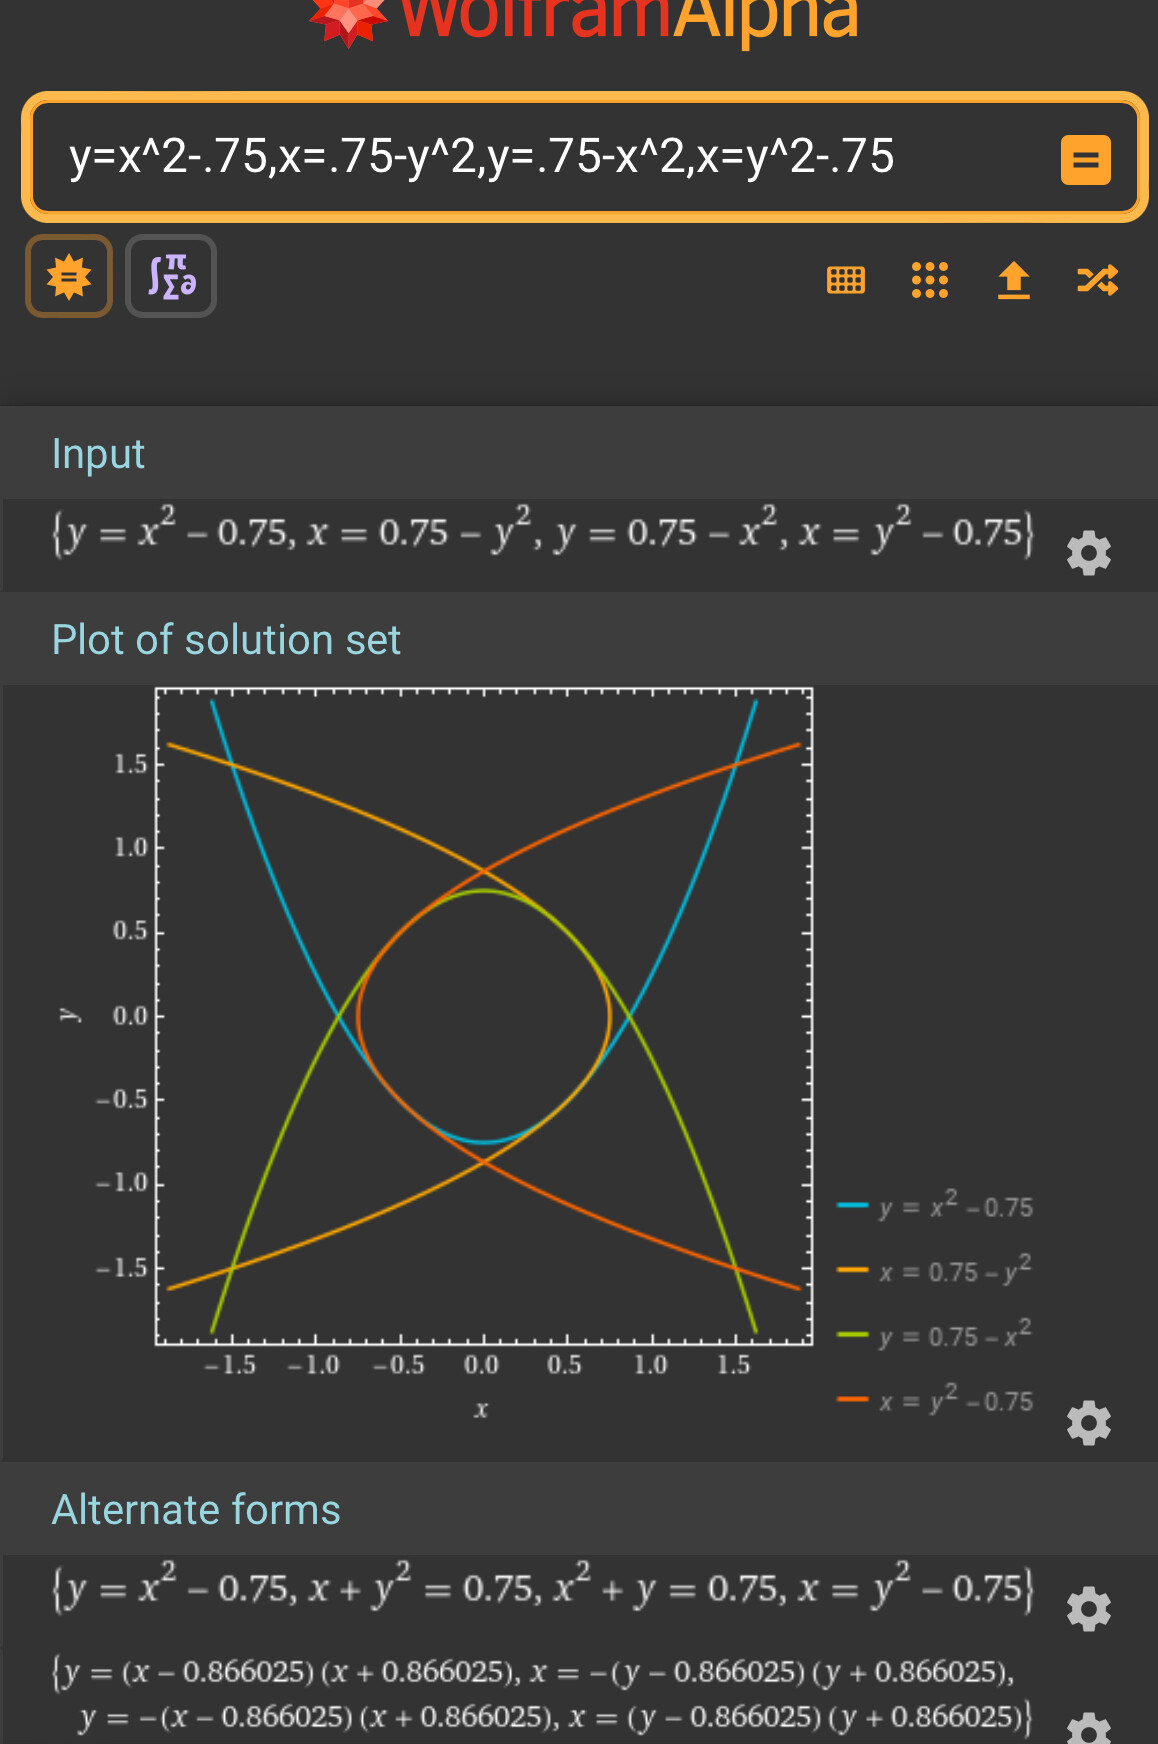
Edit: a lot of these are pretty easy to just do in wolfram alpha. I don’t have enough phone power to finish but just type “r^2+theta^2=100” into wolfram alpha and it shows you. Looks pretty cool!
Editedit:
Your calculation of the claw areas is fine. Just replace n with k and it shows that your area for the kth part is just k (with your normalizations). But the way you made the yin yang means the other part will be n-k (or something similar, based on the conventions you’re using) and k plus n-k is a constant.
4 Likes
Now I get the meaning your nick, math-brush… ![]()
Best regards from Italy,
dott. Piergiorgio
2 Likes
The problem is, Wolfram|Alpha graphs aren’t much help if you’re blind.
1 Like
Two books I’ve read recently about maths that I thought were very good, at quite different levels of maths:
-
Fun level: Math With Bad Drawings by Ben Orlin. Laugh-out-loud funny with lots of approachable discussions of numbers in everyday life. Even my colleagues who hate mathematics thought this was a great book that made them feel more knowledgeable about the likes of geometry and lotteries. (One colleague’s read the whole thing and colleague #2 has borrowed it).
-
A bit more advanced: How to Think Like a Mathematician by Kevin Houston. The last half is above my capability but I like the first half. It contains a section on how to study mathematics I wished I’d been taught at school, a method for tackling proofs and a nice summary of mathematical logic (the last part tracks with and considerably extends my understanding of the subject from my formal logic philosophy class). Students considering university entrance or in the early stages of a numerate degree course would benefit from this.
2 Likes
Yeah, I suspect a lot of my musings would be easy to find the answers to if I still had a working eye and could make use of existing software. Sadly, finding software for any kind of graphics generation that works well with a screen reader and keyboard-only input is hard, and then getting the output into something blind usable is another issue, especially when one doesn’t have lots of money to spare… There is a talking version of the TI-84 available, but it costs $700 and even then, it can only really let a blind person trace a graph and try to build up a mental image, brailledisplays and embossers start in the hundreds and braille displays don’t have the resolution for graphics and not all embossers can go off the grid to do freestyle, so you kind of have to do the Braille equivalent of ASCII art, which probably wouldn’t be too bad for 2-d graphs that are just lines, curves, and monochrome shaded regions of the plane, and even if I could write a script that mathematically defines a 3-d object, feed it to a parser that spits out an stl, and owned my own 3-d printer that I could tell to print and then forget about it, I’d have no way of previewing what I’m about to print… and as far as I know, the most advanced tactile graphics display on the market has a resolution of 40*60, does the equivalent of five shades of gray, and costs 15 grand. And there just aren’t enough blind people to drive the economies of scale needed to drive prices down if the accessible tech can’t piggy back off of mainstream tech.
And maybe I didn’t explain the parabola thing well… When you join two parabolic segments so both of the joined endpoints are tangent to the same line(e.g. the joint is smooth), the segments can be on the same or opposite sides of the tanget line… if they are on opposite sides of the tangent line, for a segment that has the vertex of the parabola as its midpoint, this forms what could be called a parabolic wave with one segment forming a through and the other a crest… but if the parabloas are on the same side of the tangent line, they wrap around some center point… my intuition is that you would have to truncate pretty close to the vertex of the parabola to get a convex, closed curve repeating the process and that most would have self-intersections… Or working from the opposite end, imagine making a curvy version of a pentagram by drawing parabolas such that the symmetry axis of the pentagram coincide with the axis of the parabolas, and the parabolas are tangent to the pentagram at its edge midpoints.
On a somewhat related note, if you take four copies of y =sin(x) from x= 0 to x = pi, I’m pretty sure you get a closed, smooth, convex curve joining them endpoint to endpoint… a fact that got me wondering about what exponent for a supercircle(aka a superellipse with equal major and minor axises, x^n+y^n=r^n for n > 2) is closest to this sine curved derived shape… and of how to fill in the gaps to make a solid if you took three orthogonal copies of the curve as sort of the skeleton of a solid… and my apologies if I’m not making much sense, had I an accessible means of creating visual aids, I’d be sharing them… and as much as I love Zome Tool and Polydron, Zome is useless for anything involving curves(unless you count approximating circular arcs with decagons or dodecagons and elliptical arcs with irregular hexadecagons), and Polydron is useless for curves other than quarter circles of unit radius(unless you cound approximating circular arcs with icasagons or triacontagons, both of which are of an unruly size in Polydron).
Though, to give props to what manipulatives I have access to, I feel like I wouldn’t understand the sphenocorona and the other sporadic Johnson solids had I not built them with polydron(sadly, not all Johnson solids are polydron constructible(the base edges of the pentagonal pyramid and pentagonal cupola are too sharp for the hinge joints polydron pieces make). Also don’t think I would have realized the icosahedron can be seen as a combination of a corona and megacorona without polydron… and I have found a few polydron constructible Johnson near-misses(on of my favorites separates a dodecahedron into two bowls made of siz pentagons, rotates one by 36-degrees, and fills the gaps with pairs of triangles. The Polydron model has no strain whatsoever, the pentagons are truly regular, but the triangles are very slightly isosceles(I think the triangle-triangle edges are something like 1.07 times the length of the pentagon-pentagon and triangle-pentagon edges).
Also, when I found out about cyclogons(basically cycloids, but the rolling shape is a polygon rather than a circle), it got me wondering wht the patterns traced by the vertices and edges of a polyhedron as it rolls around a tiling of hte plane or around another polyhedron(mainly thinking cube on a square tiling or around another cube, tetrahedron, octahedron, or icasahedron around a triangular tiling or each other, , a dodecahedron around another dodecahedron, or a truncated icasahedron around a hexagonal tiling where it’s only allowed to roll over hex-hex edges… or going back to cycloids, instead of circles rolling around circles, using cones or cylinders and tracing out the path of a segment instead of a single point(such as rolling a cone around a cone, tracing the path of a segment connecting the rolling con’s apex to it’s base edge or rolling a cylinder around a cylinder and tracinga diagonal of the rolling cylinder’s longitudinal section… or tracing a meridian of a rolling sphere or doing traditional cycloids, but insted of a single point, apply a gradient to a diameter and trace a family of cycloids…
Ugh, so many ideas in my head, no good way to get them out.
5 Likes
Ah that’s so cool! Sorry I didn’t address your visual impairment, I only get snatches of internet and went through your post very briefly. I like your ideas and thank you for the clarification!
2 Likes
I used to be very strong in Mathematics at school, winning Scotland-wide Mathematical Challenge prizes in a couple of years. Just the other day I found 1980s newspaper articles about this with photos of young me and other prizewinners! I continued to study Maths for two years at university, but part of a computer science honours degree, and almost astronomy honours, but had to choose which so went with computer science. Then as I started a software engineering PhD aged 22 my progressive neurological disease started, and I had to drop out. And later retrained very part-time from scratch (3 more degrees!) as an academic historian. But I do retain a fondness for recreational maths puzzles. Lewis Carroll’s maths puzzles were a huge influence on me as a youngster.
My husband switched from astronomy to a PhD in formal theorem proving/computer algebra/software. Officially under the umbrella of computer science, but very strongly mathematical leaning. Later he developed software for NAG of Oxford (Numerical Algorithms Group Limited) who provide numerical analysis etc libraries. And then switched to space technology research, within a university computer science department. He has to do pretty high level maths things daily. I boggle. But I never got that far.
And on the subject of Maths the ClubFloyd transcript of my game Napier’s Cache has just gone back up, after being offline (not at my request) for years. It was marvellous fun for me to see how the players reacted to the game. Which can still be played/downloaded from IFDB links. The game name comes because it is based on a true life event of mathematician John “logarithms” Napier. And a true story in my personal family history. AllThingsJacq.com - Interactive Fiction | ClubFloyd - April 5, 2020 - Napier's Cache by Vivienne Dunstan
13 Likes
But ta mathēmatika is neuter plural, so it would take a singular verb. I have no idea whether this is a point for or against math versus maths, but it is definitely a point for languages’ being weird.
4 Likes
I have a degree in set-theoretic topology, for what it’s worth (also another one in theoretical physics, which often comes even less handy). So I understand the language; I can’t claim much more than that. Glad to see other topologists in the forum.
Not a lot since Galois; that set a really high bar. ![]()
(technical blah follows)
One of the sources of current amusement is how many additional assumptions can be added to large cardinal independence results before the whole of the ZFC framework becomes inconsistent (List of statements independent of ZFC - Wikipedia). The answer seems to be “many”, although nobody knows where the tipping point is, but we know a lot more about that now than 50 years ago. There are a number of interesting topological conjectures that turn out to be decidable in the presence of large cardinals. This is a very active, although very niche, area of research.
8 Likes
Okay, after the positive feedback I got on my programmatically generated avatar in the avatar thread, I decided to toy around with using similar ideas to generate some wallpapers… Thought of starting a new thread for such, but since this got bumped and I’m basically using math to color the plane in a hopefully appealing way, I figured, why not post here.
All of the programmatically generated images I’ve uploaded can be found at:
http://sightless-sanctuary.net/Graphics/Programmatic/
ColorCompass contains the image I uploaded for my avatar and what should be it’s three component gradients.
primeDiamonds, if my logic is correct, contain variants based on a square gradient turned 45-degrees to the grid, taking the sum of the absolute values of x and y mod 255 to determine the brightness of each point and keep things within range, and the red, green, and blue channels are masked so they only show up for multiples of 2, 3, and 5 respectively. And I would love a sighted person’s opinion on what the actual images look like(I can guess what they look like, but I lack a functioning eyeball to confirm or deny my expectations.
The readme includes greater details on what I did to generate the images.
6 Likes
I really love the alternating color patterns of these!! Especially because they reveal themselves as I zoom in! It’s like scratching a brain itch! ![]()
I especially love how the error one is arranged more like brackets than continuous shapes!
3 Likes
PrimeError gives me an optical illusion that it’s always zooming in. I thought it was an animation at first. Very neat! In fact, I checked the others and they also give the illusion of motion. Would be fun as a background for IF cover art.
3 Likes
Huh, an illusion of motion was totally unexpected… makes me wonder if the illusion would persist if the image were grayscale, the luminosity even, or the bands further apart, or if it’s specifically the combination of different colors, gradually increasing luminosity, and close spacing.
Hmmm… starting from 1, the color pattern should be(using RGB CMYK and W for white):
KRGRBYKRGM
KYKRCRKYKM
GRKYBRGRKW
Which then repeats every 30 steps if I’m not mistaken… and 256 isn’t a multiple of 30, so the color and luminosity cycles only repeat the same alignment every 3840 steps… I generated the primeDiamond series of wallpapers at 1080*1920, but the pattern would only truly repeat if extended well beyond 4k resolution… just looked it up, 3840 is the width of 4k, so even if the pattern was being done across columns starting at one edge, 4k is just enough to complete the pattern…
Okay, just generated and uploaded primeBright.png and primeDark.png which remove the luminosity gradient. the Dark version sets R, G, and B to 128 where ever they aren’t 0, and the Bright sets them to 254. And the reason for 254 is because I discovered a slight bug in my code, namely that I was doing mod 255 to keep values within the correct range instead of mod 256, so when I tried sitting them to 255, the code would mod them down to zero and I ended up with an image that was all black… not sure it matters, but I figured matching the brightest possible colors from the existing version was more important at the moment than fixing the bug.
I think my next step might be to try and generalize the code a bit. right now, all of the parameters are hardcoded and any changes to the outputted image require editing the code, recompiling, and running just creates the file without any terminal output… Shouldn’ be too hard to upgrade it to prompt the user for things like height and width of the image to be generated, coefficients of x and y, and the divisor that determines whether a given pixel includes a given primary, and once that’s done, sharing the code to let people play around with might be worthwhile.
4 Likes
Sorry for double post, but I can’t find the edit button, assuming it exists.
Well, generalized my code a bit and decided I have something worth sharing and letting others play around with. The binary I compiled on my Debian AMD64 machine, the single .cpp source file, and a few images I generated to do what testing I can can be found at:
http://sightless-sanctuary.net/Graphics/Programmatic/ColorGraph/
Sorry to any Windows/Mac users who don’t know how to compile stuff, but I have no idea how to cross compile for other platforms.
If you do play around with it, I’d love to hear how varying the parameters affect the generated images… I’m guessing setting an x or y coefficient to zero turns a gradient’s direction either vertical or horizontal depending on which is zeroed, that setting both to zero just leads to a flat field of color for that channel, that a positive baseline brightens the channel as a whole, a negative baseline darkens, but I’m not sure what making the coefficients something other than 1 or making them negative would do…Pretty sure vertical and horizontal and one direction of 45-degree diagonal gradient are possible with this version, but no clue if non-45-degree diagonals or diagonals with the opposite orientation are possible… Feedback on interface is welcome too, though I confess, I have no idea how to make GUIs(and my attempts at making ncurses interfaces have lead to code that is a buggy, uncompilable mess.
Also, here’s a copy paste of the readme I wrote for this first public alpha(Sorry for any add formatting, the actual file is hardwrapped for the Linux console, which doesn’t always look the best in a web browser):
Color Graph Readme
Author: Jeffery Wright
Version 0.0.1
Color Graph is an attempt to generalize previous little programs I’ve
written that use the ASCII version of the Portable Pixelmap format to
generate images based on some numerical pattern. All previous programs
I’ve written in this vein hardcoded everything, so changing the image
generated required editing the source code and recompiling.
This initial public version has the following features:
*Lets the user set a base filename for the output(the .ppm filename
extension is added automatically).
*Lets the user select the height and width of the output images.
*Generates a set of 4 images based on the following equations:
r = ax + by + c
g = ax + by + c
b = ax + by + c
With one image for each color individually and one for the three
combined. The component images are named with their color appeneded to
the end of the user selected filename.
*Lets the user select the x and y coefficients for each color channel as
well as the constant(referred to as the baseline in the program’s
prompts). At present, these are restricted to integer values.
*Evaluates the equations for each integer ordered pair(x,y) using half
of the height and width for the positive and negative limits. If Height
and Width are even, the lines x=0 and y=0 are skipped. Future versions
might replace these predetermined bounds calculated from height and
width with user selected bounds and calculating height and width from
bounds.
*A text-based interface that prompts the user for each parameter and
accepts keyboard input.
*Keeps output in the right range by taking the absolute value of the
equations to keep subpixel values positive and taking the modulus 256 to
keep values from getting too large.
Files available to the public include:
Readme.txt: This readme.
ColorGraph.cpp: the source code.
ColorGraph-0.0.1.bin: A binary executable compiled on Debian Testing
amd64 using g++ version 13.
A smattering of optimized .png files converted from .ppm files generated
as a test of the program.
I have only tested this program on 64-bit Debian, but have no reason to
expect issues compiling and running on other versions of Debian, other
distros of Linux, any version of Windows, or on MAC OSX. At the same
time, I can offer no advice for compiling on anything other than a Linux
box and have no idea how to cross-compile for Windows or OSX.
Also, due to being blind, my ability to test is limited. I can confirm
the program compiles, runs, prints the correct user prompts, accepts
reasonable inputs, and outputs valid Portable Pixelmap files, but I can
say very little about the actual contents of the output files.
You will need external software to either view the output files or
convert them to a more widely supported format. As the files are
ASCII-based, they can be viewed in a text editor, but all you’ll see is
a super short header followed by a bunch of RGB triplets printed as
space delimited decimal numbers, one pixel per line. Fellow Linux users
can use optipng to convert the output files to optimized png files, but
I don’t know if optipng is available for Windows or OSX, so non-Linux
users are on their own. All of my programmatically generated images were
converted using optipng with the -o7 preset.
Features I hope to implement soon:
*the option to apply a mask that cancels out a color if it isn’t
divisible by a user defined value. Masking red by 2, green by 3, and
blue by 5 is in the code, though commented out for the pre-built binary,
so it’s mostly a matter of adding the prompts to the user.
*The ability to pick from more than one kind of equation. The most
obvious choice would be to optionally take the absolute value of ax or
by or to allow for quadratic or cubic terms.
*Implement the option to generate multiple images that could then be
joined into an animation.
*Implementing an output file that stores the parameters used in a human
readable format.
Features that are more long term projects in their own right:
*A better interface.
*Being able to input any equation, even one with non-integer outputs.
*Drawing traditional cartesian, parametric, and polar graphs over the
color graph.
*Adding alpha channels to images and generating voxel graphics.
1 Like
I got aware of that sentence just now, though it’s already a month old.
For me it’s the same level of math. And chess! I can easily beat people at chess, who have never learned chess tactics, but a club player would beat me very thoroughly. I wonder if there’s a word for that level. Maybe “semi-professional”? Maybe “between the chairs”?
In Spanish, the expression jugador de café (“café player”) is used precisely for that: an amateur good enough to beat inexperienced players but not enough to be a challenge to club players. I’m reliably told that the expression comes from the 1920s Cuban pop culture, maybe spurred by Capablanca’s success.
Maybe we should likewise adopt “café mathematician”. A good deal of great mathematics has been done in cafés, as Stanislaw Ulam and his buddies could attest to.
5 Likes
Well, in Japan, they have the Kyu-Dan style of ranks used for ranking players in Go, some schools of martial arts and some other things. Kyu ranks are for amateurs and have decreasing numbers as skill increases(e.g., depending on who you ask, an absolute beginner at the game of Go is between Kyu 50 and Kyu 30 while a Kyu 1 is just below professional skill). Dan ranks start at 1 and go up to 9, sometimes with 10 Dan reserved for someone recognized as the best in the world. If you’re familiar with American-style belt systems in martial arts, Kyu ranks are similar to colored belts while Dan ranks are equal to the degrees of black belt(some schools will even use the terms 4th degree black belt and 4 Dan interchangeably).
And to give more context to my previous comment, I did incredibly well with the standard Highschool curriculum, finishing Algebra I, HS Geometry, Algebra II, and ALgebra III/Trigonometry with grades of 98, 95, 92, and 92 while taking them all two years ahead of my grade mates, I got low-700s on the Math portion of the SAT I and both levels of Maths for SAT II and mid-30s of the Math section of the ACT(where 36 on a section is full marks)… Also got an 85 in Precalculus… my first bad maths grade ever was getting a D(which was 70-76 out of 100 in my state) in AP Statistics, which was so bad I didn’t bother sitting the AP Exam In college, I did well with Calculus I(Single variable differential calculus) Calc III(Multivariable Calculus), but really struggled with Calculus II(single variable integral calculus) needing to take it three times to barely squeak by with the C needed to make the credit transferrable and to fulfill preresquites(as far as I’m concerned, a D in college was a failing grade since it was only good for a terminal course you don’t need transferred, and it took me two attempts each to get passing grades in Linear Algebra, Discrete Maths, and Statistics for Engineers, e.g. all of the higher level maths required for a BS in Computer Science. Did well in College Geometry, which aside from Calc I/III was the only maths class I passed first try in college. Though, for the courses that gave me trouble, I think it was less struggling with the concepts and more struggling to remember all the needed formulae(or algorithms would probably be a better description for Linear algebra(matrix decomposition is tedious, but not that hard if you have the steps at hand… remembering all the steps for half-a-dozen different decompositions is Infocom levels of BS).
Though, thinking about it some more, there are the terms Apprentice, journeyman, and Master from the guilds of old, in which case, it would probably be most suitable to call myself an apprentice mathematician.
2 Likes
You have played too much IF if you read that as apprentice magician. As for the kyu-dan system, mileage varies. In Japan I was a 1-dan shogi (Japanese chess) player, but that’s nothing (I think top ranked amateur gets to 4-dan). I played some games in the Akihabara shogi club, but got trounced thorougly by the regulars. And the kyu-dan system for professional players is separate from the system for amateurs.
3 Likes